
Creating a comprehensive monthly content report is crucial for measuring the effectiveness of your content marketing strategy. A well-structured report provides valuable insights into what’s working, what’s not, and how to optimize your future content efforts. This allows you to demonstrate the return on investment (ROI) of your content, justify budget allocation, and make data-driven decisions to improve overall performance. Whether you’re managing a blog, social media channels, email campaigns, or a combination of platforms, understanding how to create a monthly content report is an essential skill for any marketer.
This article will provide a step-by-step guide on how to build an effective monthly content report that tracks key performance indicators (KPIs) and provides actionable insights. We’ll cover everything from identifying your content marketing goals and selecting relevant metrics to choosing the right reporting tools and presenting your data in a clear and concise manner. By following these best practices, you can transform your monthly content report from a tedious task into a powerful tool for optimizing your content strategy and achieving your marketing objectives.
Set Measurable KPIs
Key Performance Indicators (KPIs) are crucial for evaluating the success of your monthly content strategy. Choosing the right KPIs allows you to track progress, identify areas for improvement, and demonstrate the value of your content marketing efforts.
Select KPIs aligned with your overall business objectives. For example, if a primary goal is lead generation, relevant KPIs could include conversion rates and cost per lead. If brand awareness is a priority, consider tracking reach, impressions, and social media engagement.
Ensure your chosen KPIs are measurable. This requires establishing clear metrics and tracking mechanisms. For instance, instead of simply aiming for “increased website traffic,” specify a target, such as “a 15% increase in organic traffic within the next month.” This specific and measurable target facilitates accurate progress tracking.
| KPI Category | Example KPIs |
|---|---|
| Engagement | Likes, shares, comments, time on page |
| Reach | Website traffic, impressions, followers |
| Conversions | Leads generated, sales, downloads |
Gather Data from All Channels
A comprehensive content report requires data from all platforms where your content lives. This ensures a holistic view of your content performance.
Identify your key channels. Where do you publish content? This could include your website, social media platforms (like Facebook, Instagram, X (formerly Twitter), LinkedIn), email marketing platforms, and even offline channels like print publications, if applicable.
Use platform-specific analytics tools. Each platform offers its own analytics dashboard. Familiarize yourself with these tools. Google Analytics is crucial for website data, while each social media platform has its own built-in analytics section. Email marketing platforms also provide metrics on open rates, click-through rates, and conversions.
Consolidate your data. Create a spreadsheet or use a data aggregation tool to bring all this information together. This will facilitate analysis and reporting later in the process.
Summarize Performance Metrics
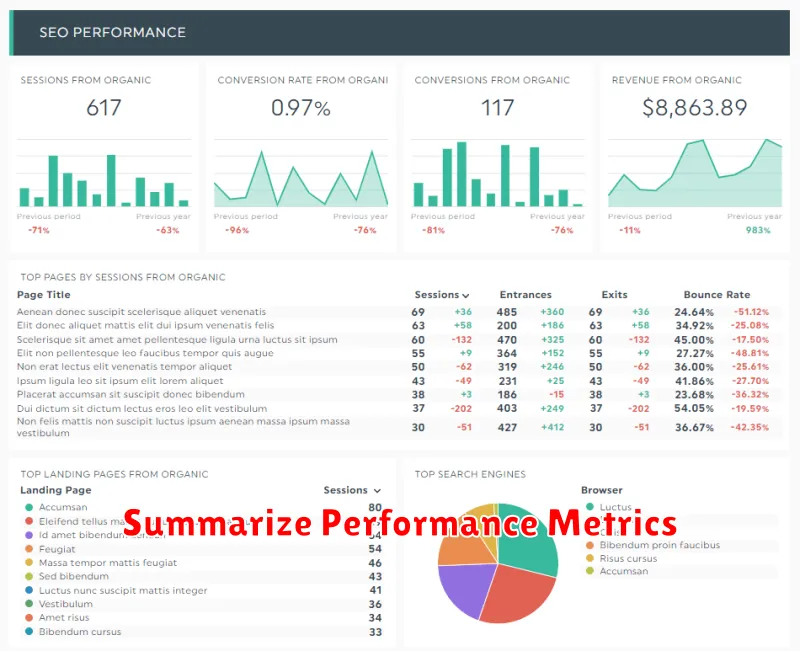
After collecting data, summarize key performance indicators (KPIs) to provide a clear overview of your content’s effectiveness. This summary should highlight the most important metrics and demonstrate the impact of your content strategy.
Organize the summarized data in a visually appealing and easy-to-understand format. A table is an effective way to present this information. Include columns for each key metric, such as website traffic, engagement rate, conversion rate, and lead generation. Clearly label each column and use consistent formatting.
Focus on presenting the overall performance trends rather than overwhelming the reader with granular data. Use clear and concise language to explain the significance of the metrics. For example, instead of just stating the number of website visits, explain whether this represents an increase or decrease compared to the previous month and what factors may have contributed to the change.
Highlight Top-Performing Content
This section of your monthly content report should focus on showcasing your most successful pieces of content. Identifying top performers allows you to understand what resonates with your audience and inform future content strategy.
Begin by defining your key performance indicators (KPIs). These metrics will vary depending on your content goals, but common examples include:
- Website traffic: Page views, unique visitors, bounce rate
- Engagement: Social shares, comments, time on page
- Conversions: Leads generated, sales, sign-ups
Once you’ve established your KPIs, analyze your content performance data and select the top 3-5 pieces of content based on these metrics. Present this data clearly, perhaps using a table format. For each top-performing piece, briefly explain why you believe it performed well. Was it the topic, the format, the promotion strategy? Identifying these factors will be crucial for replicating success in the future.
List Improvement Opportunities
After analyzing your monthly content performance, dedicate a section to listing potential areas for improvement. This is where you translate data insights into actionable steps. Focus on specific areas where content underperformed or where opportunities exist to enhance successful content further.
Prioritize these opportunities based on potential impact and feasibility. For example:
- Low-performing content: Identify articles with low traffic, engagement, or conversions. Consider revising, repurposing, or removing them.
- Content gaps: Analyze keyword data and audience feedback to discover topics where you can create new, relevant content.
- High-performing content: Explore ways to amplify top-performing content. This might include promoting it on different channels, creating related content, or updating it with fresh information.
- Technical SEO: Address any technical SEO issues that may be hindering content performance. This might include improving site speed, fixing broken links, or optimizing metadata.
By consistently identifying and addressing these opportunities, you can continually improve the effectiveness of your content strategy.
Use Charts and Visuals
Data visualization is crucial for effectively communicating your content’s performance. Charts and graphs transform raw data into easily digestible insights, highlighting key trends and patterns.
Consider using various chart types to represent different data points. For example, a line chart can effectively demonstrate content performance trends over time. A bar chart can compare metrics across different content pieces. Pie charts are useful for visualizing the distribution of traffic sources or content formats.
Ensure your visuals are clearly labeled and easy to understand. Include titles, axis labels, and legends where necessary. Keep the design clean and uncluttered to avoid overwhelming the reader.
Key metrics to visualize might include:
- Website traffic
- Engagement metrics (likes, shares, comments)
- Conversion rates
- Reach and impressions
Share with Stakeholders
Sharing your monthly content report with stakeholders is a crucial step in demonstrating the value of your content marketing efforts. Effective communication ensures everyone is aligned and informed about progress and future strategies. Prepare a concise presentation highlighting key takeaways from the report.
Focus on metrics that resonate with business objectives. Instead of overwhelming stakeholders with every data point, emphasize key performance indicators (KPIs) like lead generation, conversion rates, and organic traffic growth. Clearly explain what these metrics mean in terms of business impact.
Visualizations, such as charts and graphs, can help stakeholders quickly grasp the information. Keep the visuals clean, simple, and easy to interpret. A clear narrative accompanying the data will help stakeholders connect the dots and understand the story behind the numbers.
Be prepared to answer questions and discuss the report’s findings. Open communication fosters collaboration and allows stakeholders to provide valuable feedback. This feedback loop is essential for optimizing future content strategies and ensuring alignment with overall business goals.