
In today’s competitive digital landscape, optimizing conversion rates is paramount for any business seeking online success. Whether you’re aiming to boost sales, increase sign-ups, or drive other desired actions, understanding how to effectively leverage A/B testing is crucial. This article will provide a practical guide on how to run A/B tests that yield meaningful results and ultimately improve your conversion rates. We’ll cover everything from formulating a strong hypothesis and defining key metrics to implementing the test and analyzing the data.
A/B testing, also known as split testing, is a powerful method for comparing two versions of a webpage or app element to determine which performs better. By systematically testing different variations, you can gain valuable insights into user behavior and identify the changes that lead to higher conversion rates. This data-driven approach eliminates guesswork and allows you to make informed decisions based on concrete evidence. Throughout this article, you’ll learn the essential steps to conducting successful A/B tests, empowering you to optimize your website or app and achieve your business objectives.
What Is A/B Testing?
A/B testing, also known as split testing, is a method of comparing two versions of a webpage or app against each other to determine which one performs better. Essentially, you’re testing two variations (A and B) with your audience to see which one achieves a higher conversion rate.
This is done by randomly showing visitors one of the two versions and tracking their behavior. Metrics like click-through rates, time spent on page, and conversion rates are then compared to determine the winning version. The changes between versions can be as simple as a different headline, button color, or image, or as complex as a complete redesign of the page layout.
The goal of A/B testing is to identify changes that improve key performance indicators (KPIs) and ultimately drive better results. It allows you to make data-driven decisions rather than relying on guesswork or assumptions about what works best for your audience.
Identify Elements to Test

A crucial step in A/B testing is identifying the right elements to test. Focus on elements directly impacting your conversion goals. These are typically parts of your website or app that users interact with during the conversion funnel.
Key elements to consider include:
- Call to actions (CTAs): Experiment with different wording, colors, sizes, and placement.
- Headlines: Test different headlines to see which resonates most effectively with your audience.
- Images and Videos: Try variations in imagery and video content to gauge user preference and engagement.
- Forms: Simplify forms or change field order to reduce friction and improve completion rates.
- Page Layout: Adjust the layout to improve flow and highlight key information.
Prioritize testing elements with the highest potential impact on your conversion rate. Start with elements that are easy to change and have readily measurable results. Don’t try to test too many elements simultaneously, as this can complicate analysis and make it difficult to isolate the impact of individual changes.
Create a Hypothesis
A strong hypothesis is the foundation of a successful A/B test. It provides a clear direction and helps you measure the impact of your changes. A good hypothesis should be specific, measurable, achievable, relevant, and time-bound (SMART).
Start by identifying the problem you want to solve. For example, a low conversion rate on a signup form. Then, propose a solution. Perhaps changing the button color or simplifying the form fields.
Formulate your hypothesis using an “if/then” statement. For example: “If we change the signup button color from blue to green, then the conversion rate will increase by 5% within two weeks.” This clearly states the change you’re making (the independent variable) and the expected outcome (the dependent variable).
By clearly defining your hypothesis, you can effectively measure the results of your A/B test and determine whether your changes have had a positive impact.
Use A/B Testing Tools (Google Optimize, VWO)
A/B testing tools simplify the process of creating and running experiments. They provide a user-friendly interface to manage variations, allocate traffic, and analyze results. Two popular options are Google Optimize and VWO (Visual Website Optimizer).
Google Optimize integrates seamlessly with Google Analytics, allowing you to leverage existing data and track experiment performance directly within your analytics dashboard. It offers a free version, suitable for beginners, as well as a paid version for advanced features and larger organizations.
VWO is a comprehensive A/B testing platform with a robust set of features, including multivariate testing, behavioral targeting, and personalization. It is a paid solution catering to businesses with more complex testing needs.
These tools streamline the technical aspects of A/B testing, allowing you to focus on formulating hypotheses, designing variations, and interpreting results to improve your conversion rates.
Analyze the Results Statistically
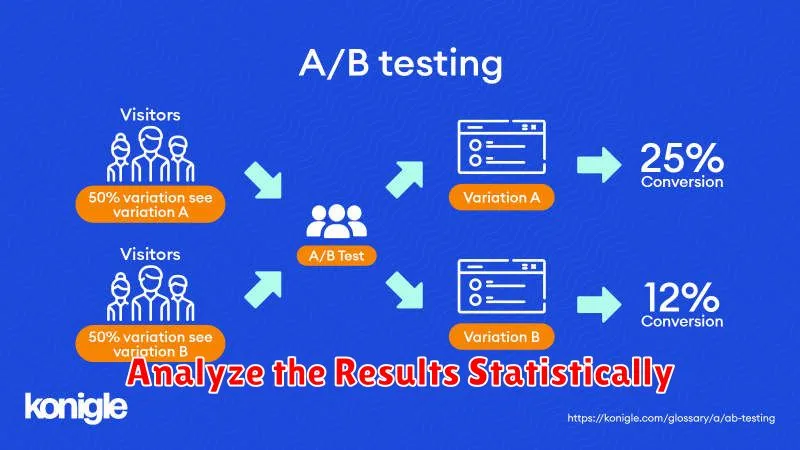
After collecting data from your A/B test, the next crucial step is to analyze the results statistically. This helps determine if the observed differences between variations are statistically significant or simply due to random chance. A statistically significant result indicates a true difference in performance between the variations.
Several statistical methods can be employed depending on the type of data you collected. For conversion rates, a common approach is using a Chi-squared test or a two-proportion Z-test. These tests compare the observed conversion rates against the expected rates under the assumption that there’s no real difference between your A/B test variations. They provide a p-value, representing the probability of observing the obtained results if there were no actual difference.
A commonly used threshold for statistical significance is a p-value of 0.05 or less. This signifies that there is less than a 5% chance that the observed difference is due to random variation. If the p-value is below this threshold, the results are considered statistically significant, and you can be more confident that the observed improvement is due to the change implemented in your variation.
Avoid Common Testing Mistakes
Running A/B tests effectively requires careful planning and execution. Avoiding common pitfalls can significantly improve the reliability and usefulness of your results. One frequent mistake is testing too many elements simultaneously. This makes it difficult to isolate the impact of individual changes. Focus on testing one variable at a time for clear insights.
Another common error is ending tests prematurely. Give your tests sufficient time to gather enough data for statistically significant results. Sample size is crucial; a small sample can lead to misleading conclusions. Conversely, running a test for too long can expose it to external factors that influence results.
Finally, ignoring statistical significance is a critical mistake. A perceived improvement might be due to random chance rather than a genuine impact from your changes. Utilize statistical tools to ensure your results are valid and reliable before implementing any changes based on A/B testing data.
Implement Winning Variants
After careful analysis of your A/B test results, it’s time to implement the winning variant. This involves replacing the original version (control) with the variant that demonstrated statistically significant improvements in your chosen metric, such as conversion rate.
Prior to full implementation, consider a phased rollout. This allows you to monitor performance in a real-world environment and catch any unforeseen issues before affecting all users. Start with a small percentage of your traffic, gradually increasing the exposure as you gain confidence in the variant’s performance.
Thorough documentation of the implementation process is crucial. This should include the specific changes made, the date of implementation, and the expected impact. This documentation will prove invaluable for future A/B tests and overall optimization efforts.